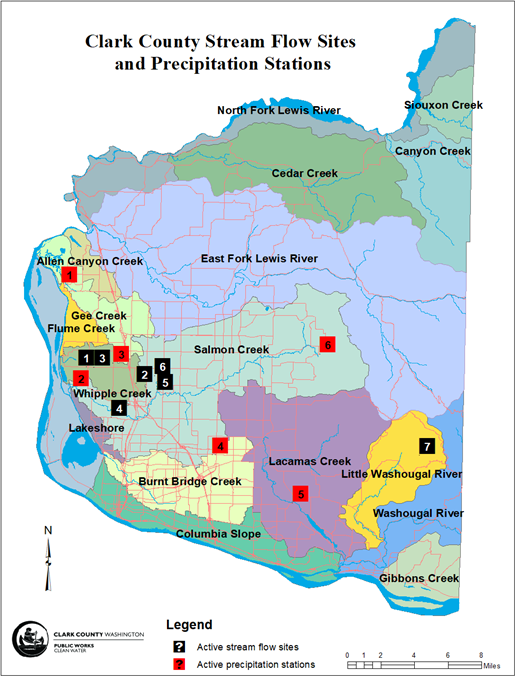
An important factor in stream health is the volume of water and how fast it moves through a stream, creek or river. Increased volumes and faster flows lead to erosion and loss of habitat (both in-stream and on the banks). The Clean Water Division monitors stream flow at seven locations and precipitation at six locations within the county.
|
|
Stream Flow
Clean Water division collects stream flow data at seven sites throughout the county and has data available through water year (WY) 2021. Additionally, Clean Water has historical data at inactive sites listed above (please inquire about time periods available). Clark County stream flow data is available in the following formats:
- Hydrographs depict how average daily flow varies over time in cubic feet per second in .pdf format.
- Daily average stream flow provide the average daily flow values in cubic feet per second in .csv format.
- 15-minute stream flow time-series data provide instantaneous flow in cubic feet per second at 15-minute intervals in .csv format.
Precipitation
Clark County precipitation data is available in the following formats:
- Daily/monthly precipitation tables provide the daily and monthly total accumulated precipitation in hundredths of inches in .xlsx format.
- 15-minute time-series data provide accumulated precipitation in 15-minute intervals reported in hundredths of inches in .csv format.
Water Year
Stream flow and rainfall data is presented by water year. A water year begins October 1 and ends September 30 of the next year. The name of the water year is based on the January - September portion of that time period. For example, WY 2021 is from October 1, 2020 through September 30, 2021.
More information
For more information about precipitation data and streamflow data, please contact us at 564.397.4018 or email cleanwater@clark.wa.gov.
Need current precipitation data?
Visit the USGS web page for more information and data:
Other regional sources can provide additional data: US Climate Data
