Heat Watch

Extreme heat is the deadliest weather-related hazard in the United States. Washington summers are getting longer and hotter, and extreme heat waves are becoming more frequent. But the impacts of extreme heat are not evenly distributed. Location matters. Some communities and families are impacted by excessive heat more than others, and this can worsen health inequities.  

People who live in historically disinvested neighborhoods, who have limited access to resources and greenspace, and those struggling with additional health issues are all at greater risk for impacts from extreme heat. 

The Clark County Heat Watch provides a snapshot in time of how urban heat varies across neighborhoods in the county and how local landscape features affect temperature and humidity. This data can be used to inform community decision-making, guide plans to mitigate the impact of hotter summers, create more resilient communities and save lives. 


tag

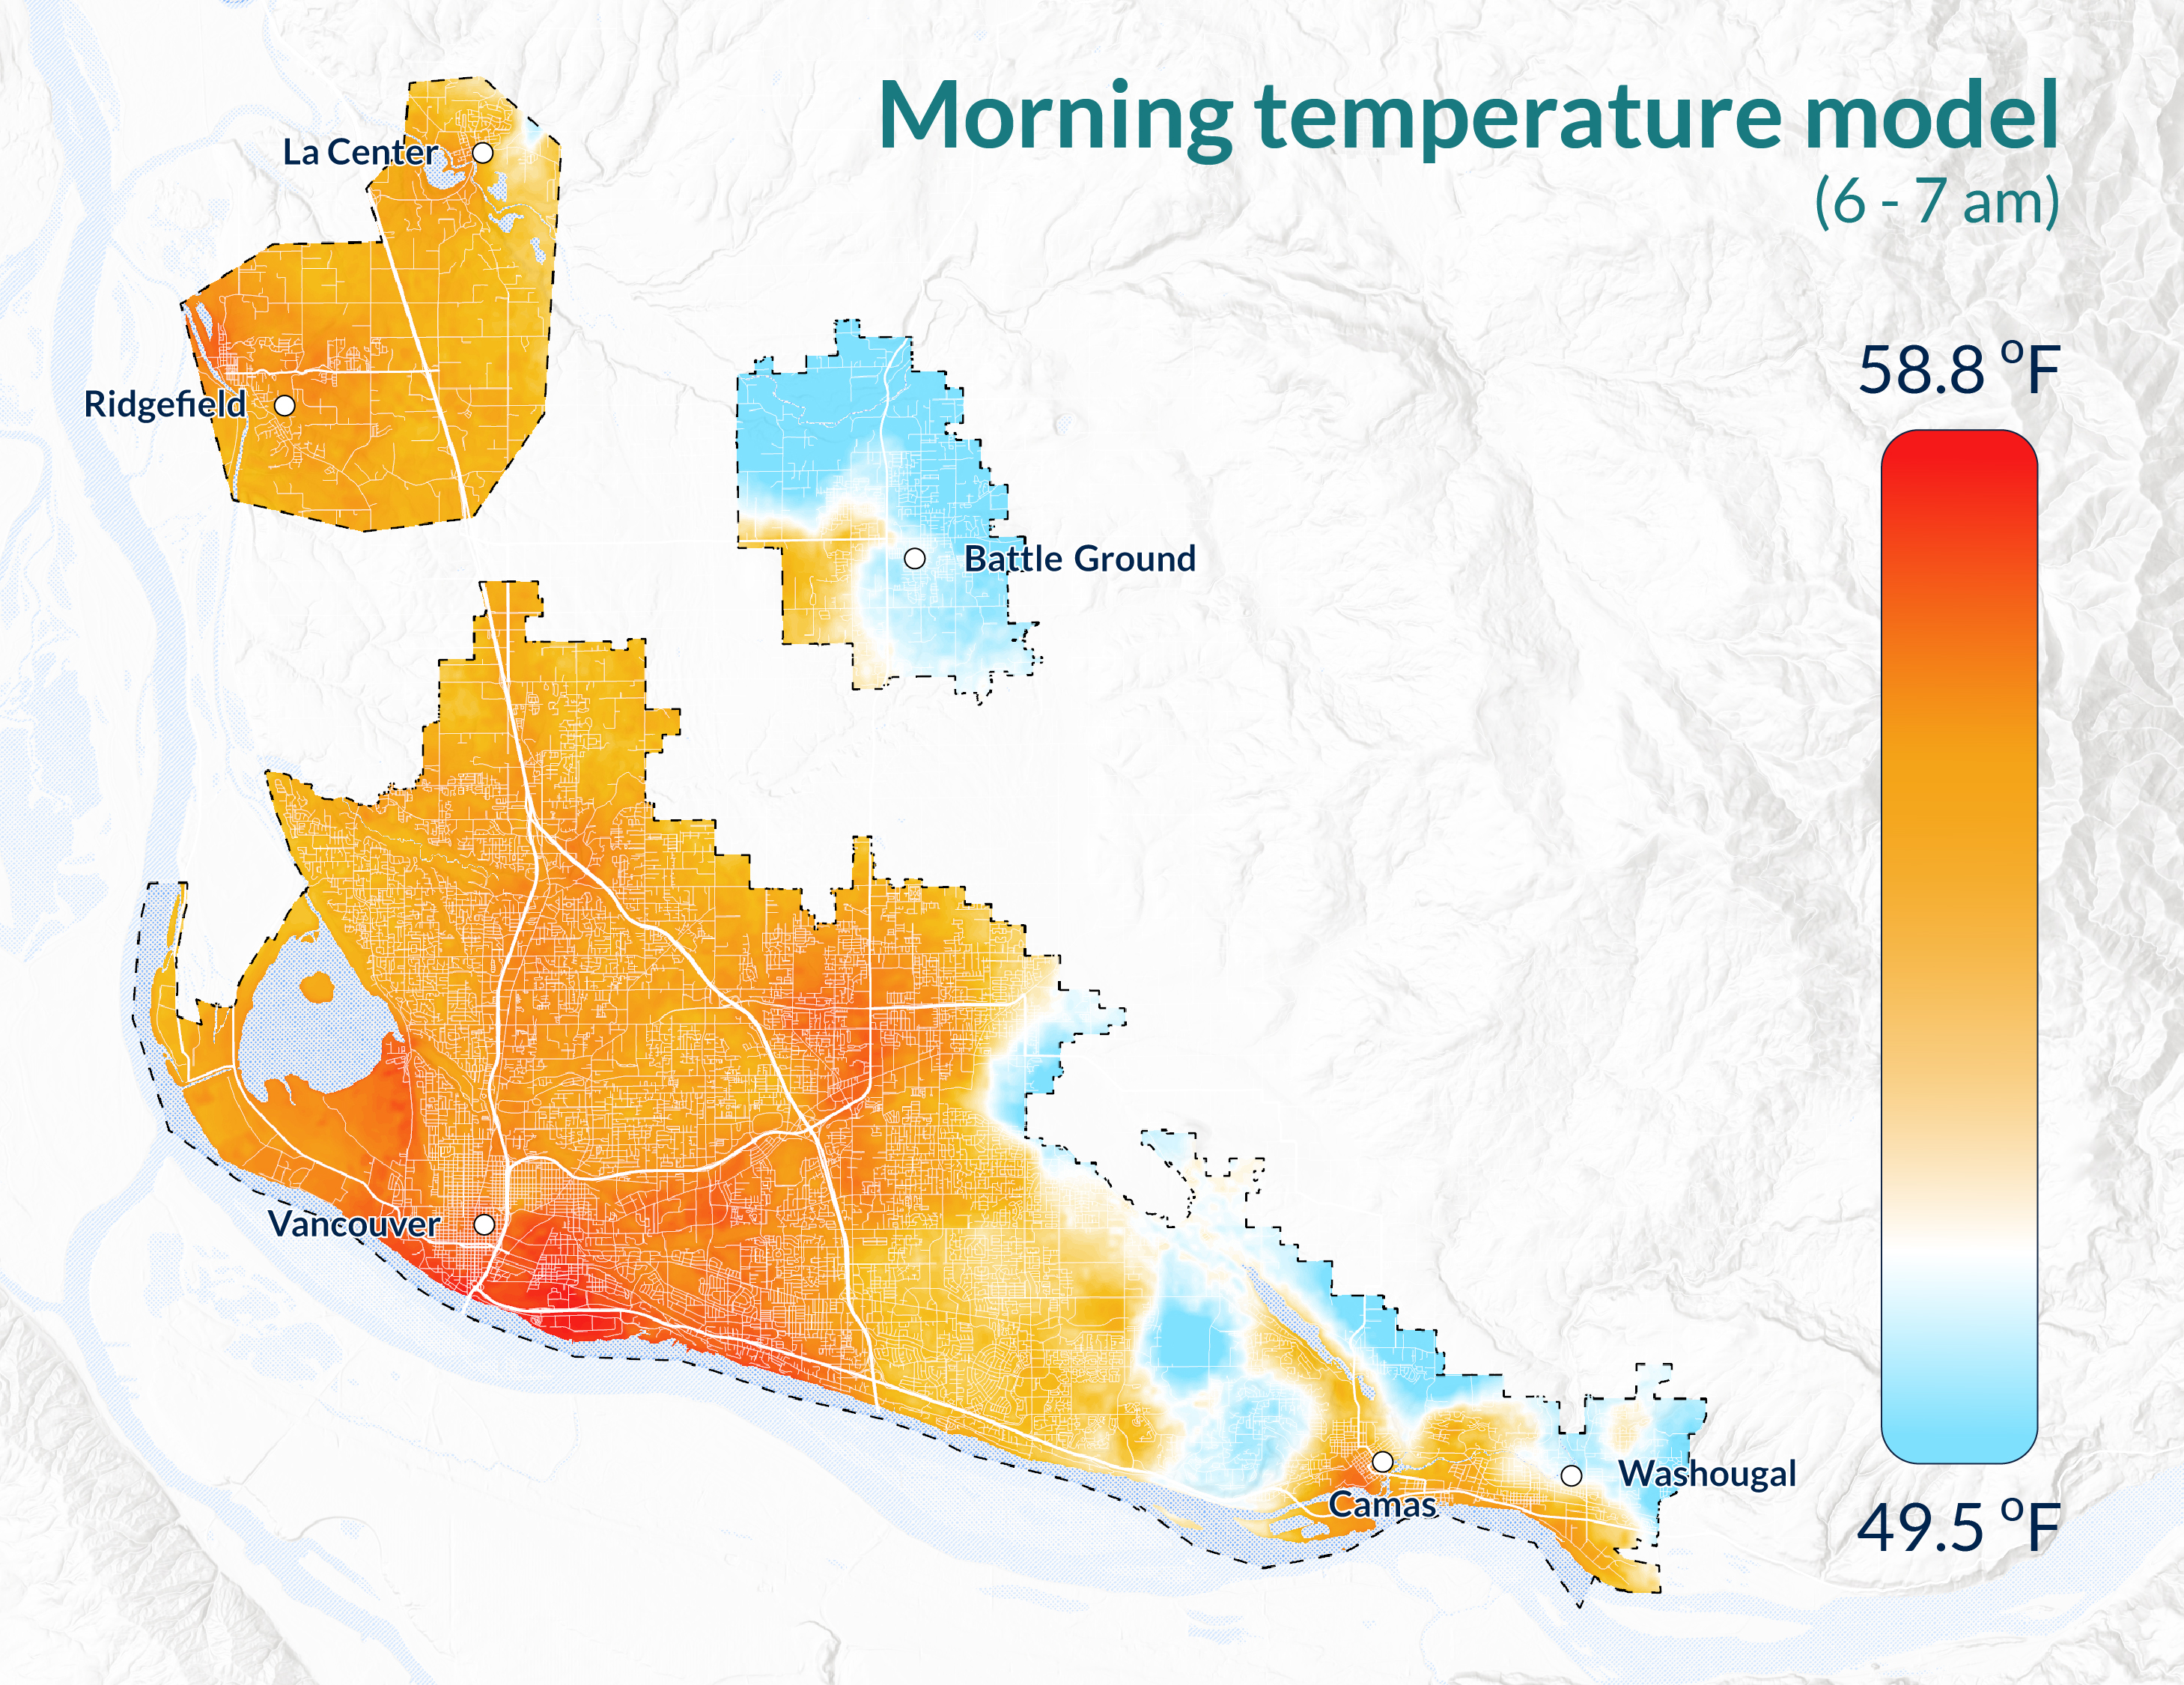
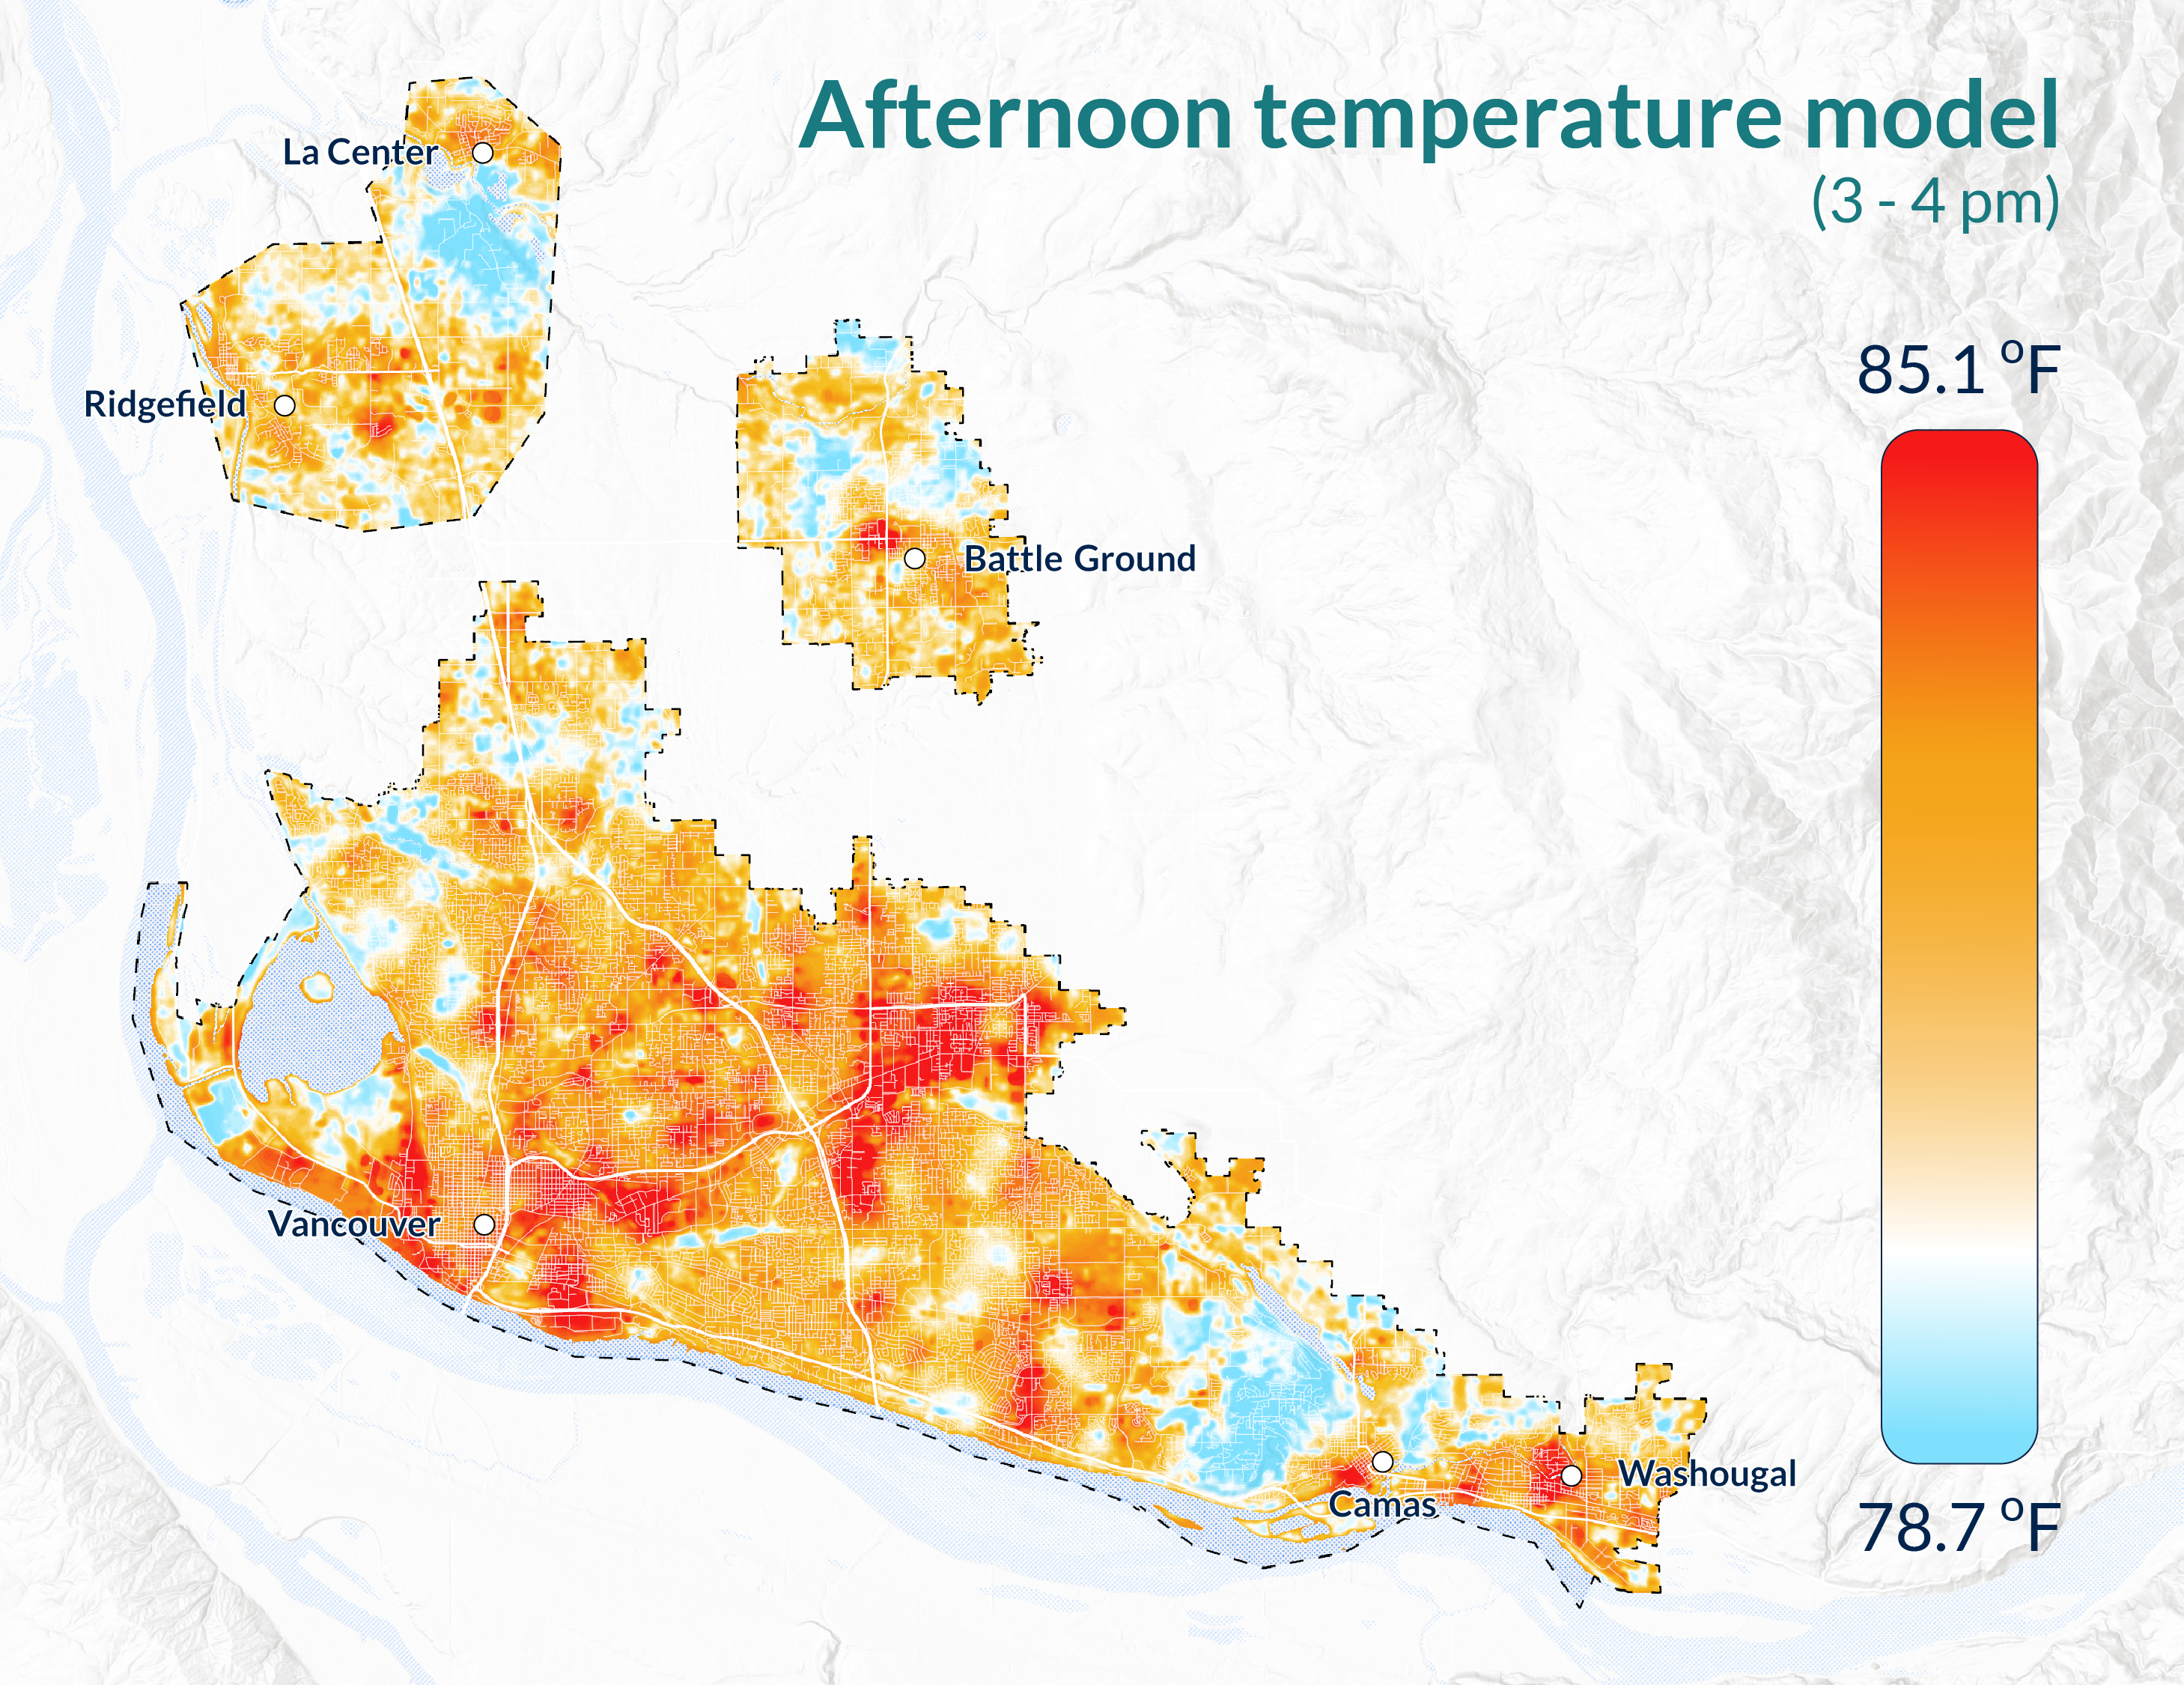
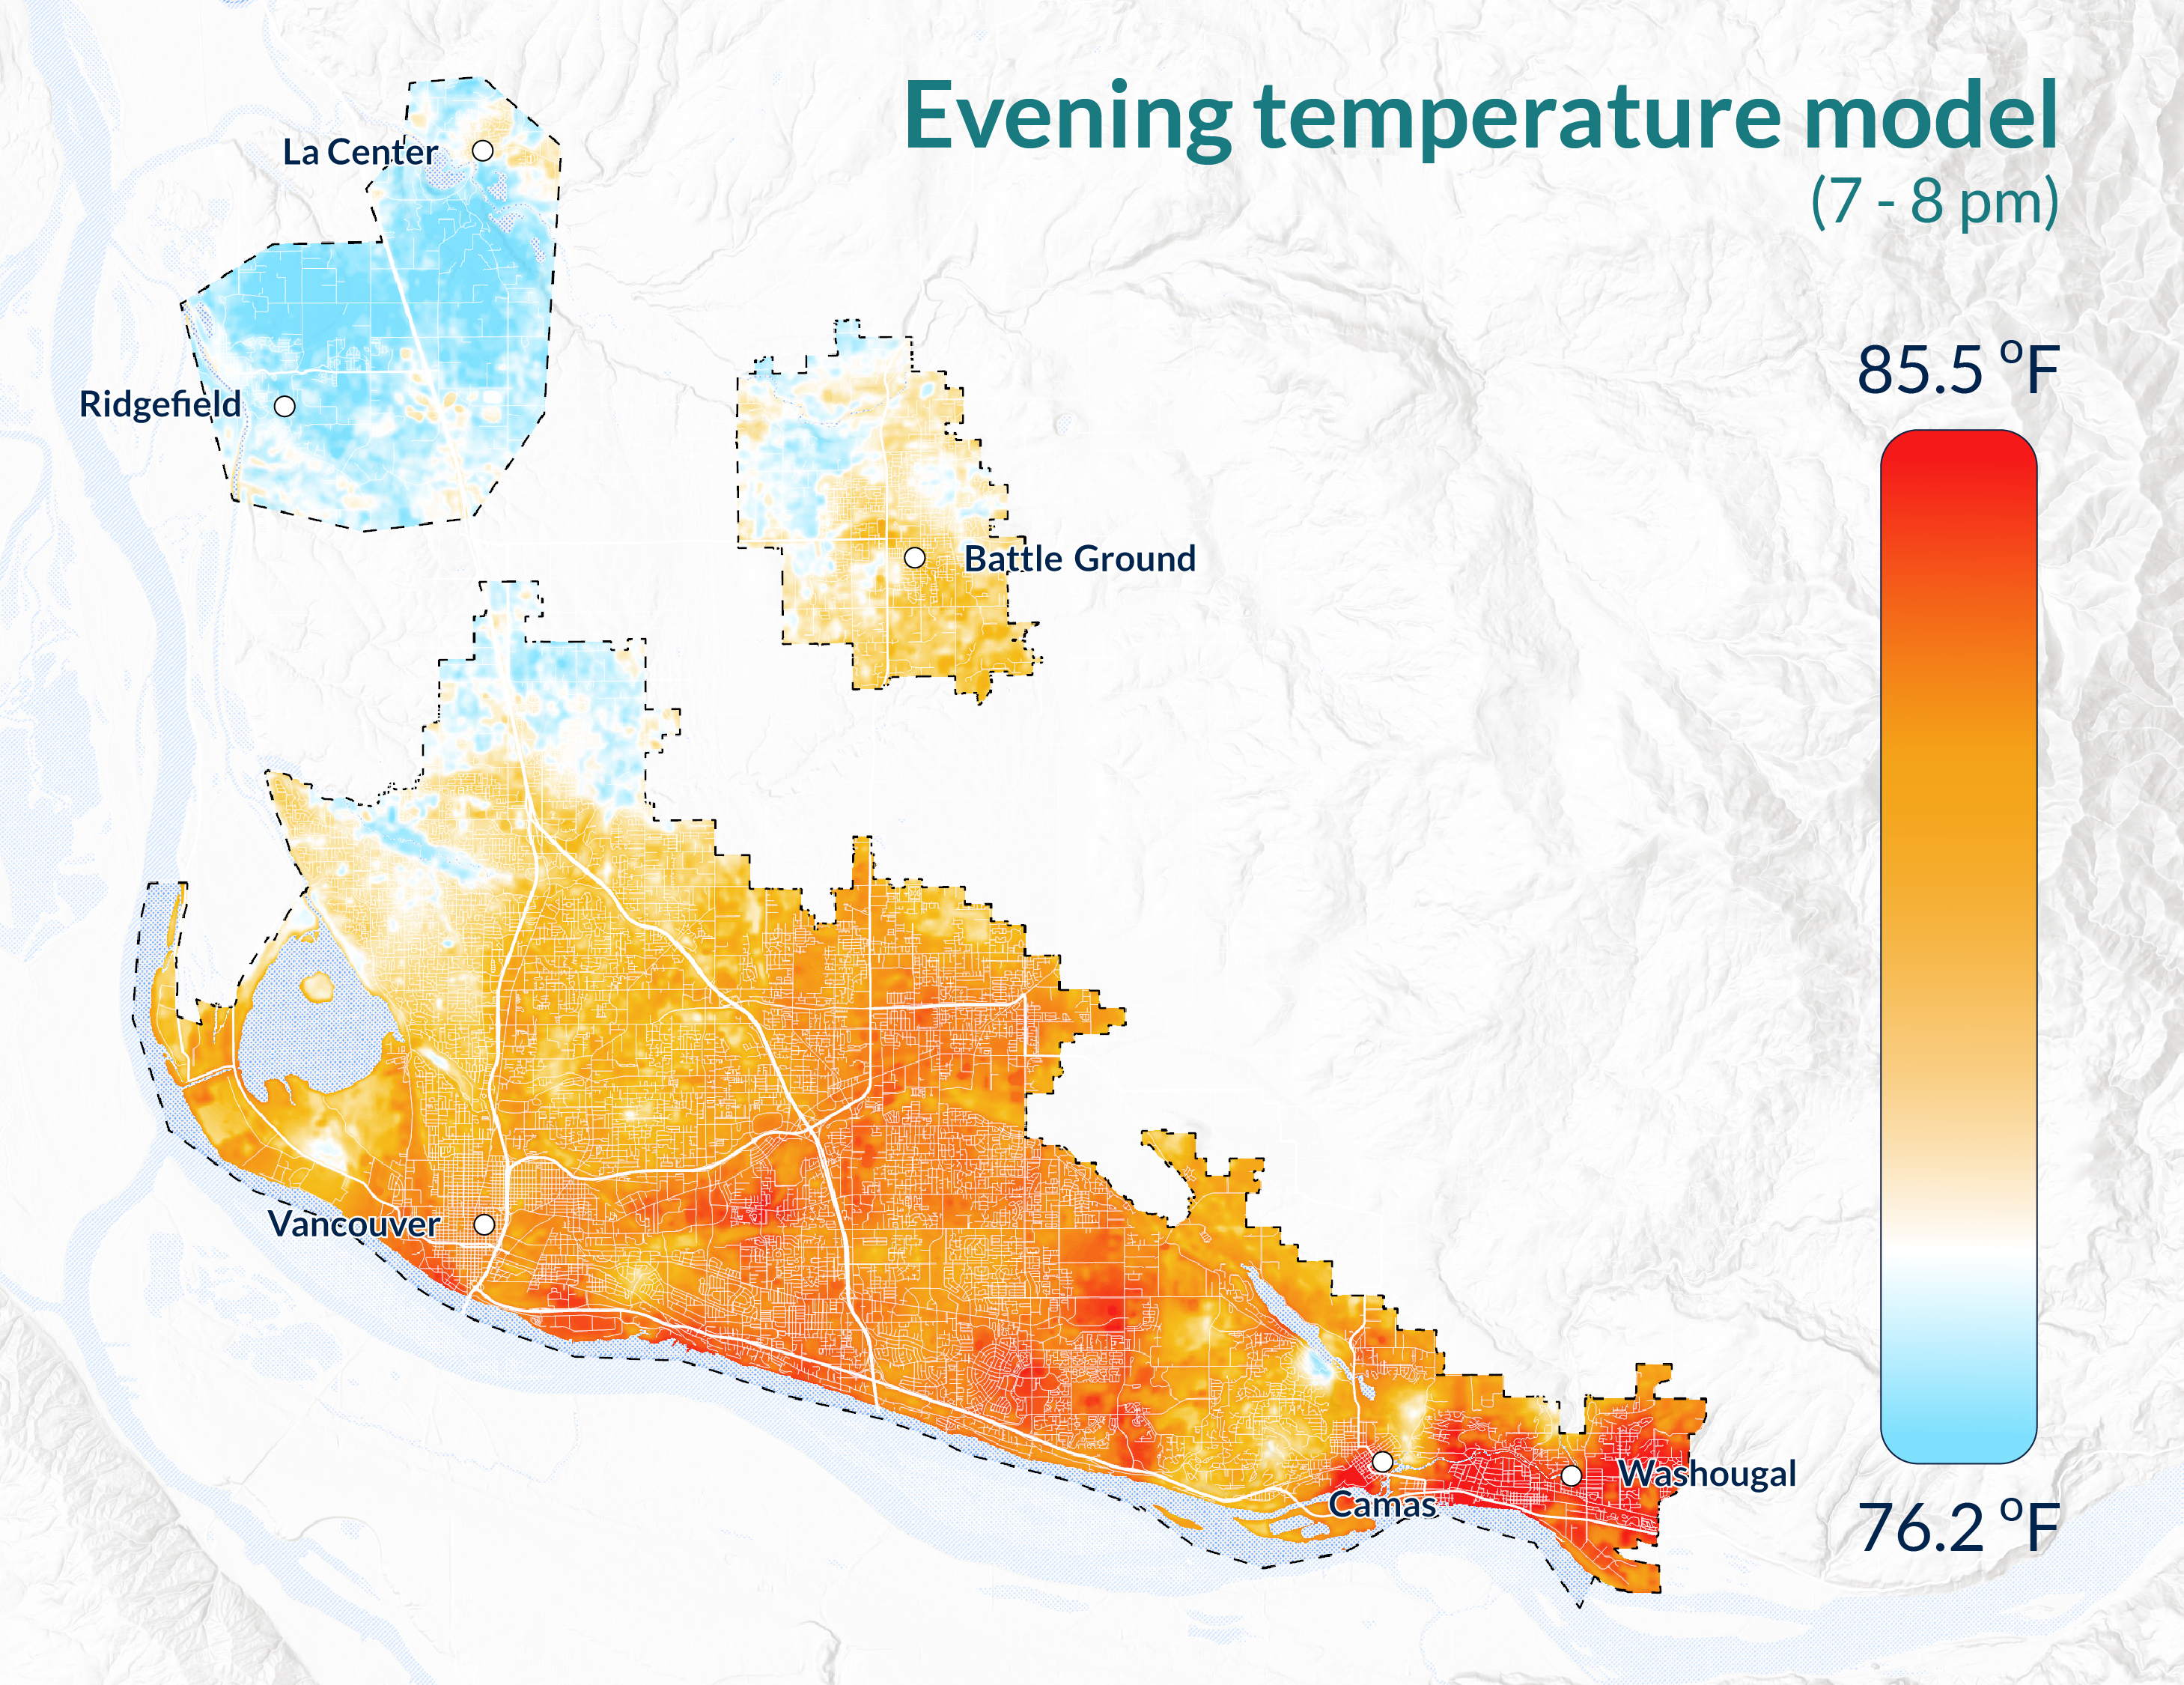
Heat Watch data was collected on July 12, 2024, during a one-day event organized by Clark County Public Health with the support of more than 50 volunteers, local government partners and technical assistance from CAPA Strategies. Volunteers attached special equipment to their cars, drove planned routes across the county, and collected thousands of temperature readings. Temperature readings were collected along those routes three times that day: morning, afternoon and evening.  

tag

Study date: July 12, 2024 
Study area: 167.4 mi2 
Volunteers: 54
Routes: 17
Measurements: 102,786
Max traverse temperature: 87.8
Max temperature differential: 11.7

tag

Clark County Public Health extends its gratitude to the more than 50 volunteers from partnering community organizations and local government who made this project possible:  

  • Aaron Lande
  • Almenda Velazquez-Perez
  • Amy Wilson
  • Andrea Pruett
  • Annette Wesolowski
  • Arthur Simons
  • Barbara Cole
  • Beverley Packard Baugh
  • Brett Raunig
  • Carolee Teigue
  • Colleen Chun
  • Daniel Baugh
  • David Hudson
  • Denise Stevens
  • Douglas Slack
  • Dustin Daniel
  • Elizabeth (Beth) Lee
  • Eric Hahn
  • Fae Jackson
  • Greg Rentfro
  • Jenna Kay
  • John Nohr
  • Jon Himes
  • Karen Schaefer
  • Kelly Watanabe
  • Kenneth Stickeny
  • Kimberly Salsman
  • LaDonna Slack
  • Lisa Dong
  • Mallorie Quiring
  • Mary Fudge
  • Mary Maxon
  • Melissa Martin
  • (Nancy) Sue Abell
  • Pat Hopstad
  • Rebecca Small
  • Richard Carr
  • Robyn Beers
  • Ruth Stickney
  • Sara Brugger
  • Scott Abels
  • Sharon Ferguson
  • Stacey Dalgaard
  • Steven Dong
  • Sue Marshall
  • Susan Jacobs
  • Susan Knowles-Berry
  • Teala Alvord
  • Terry McVay 
  • Tom Nishimura
  • Trinh Le
  • Valerie Striplin
  • Vanlena Le
  • Yasmina Aknin
tag
Partner organizations
  • Clark County Community Planning 
  • Clark County Council 
  • Community Emergency Response Team (CERT) 
  • Clark Regional Emergency Services Agency (CRESA) 
  • Clark County Sheriff’s Office Search and Rescue (CCSO SAR) 
  • Clark-Cowlitz Fire Rescue 
  • City of Vancouver 
  • Fourth Plain Forward 
  • Medical Reserve Corps (MRC) Volunteers 
  • PeaceHealth 
CAPA Strategies Consultants 
  • Eliza Amstutz 
  • Joey Williams
Clark County Public Health Staff
  • Amy Koski
  • Amy Wilson 
  • Charlotte Royal
  • Jan Dolph
  • Lauren Henricksen
  • Marissa Armstrong
  • Megan Holt
  • Melissa Martin
tag

The CAPA Heat Watch program, equipment, and all related procedures referenced as part of Clark County Public Health’s July 2024 Heat Watch Campaign were developed through a decade of CAPA research and testing with support from national agencies and several universities. 

Most importantly, these include CAPA’s partners at the National Integrated Heat Health Information System, the National Oceanic and Atmospheric Administration’s (NOAA’s) Climate Program Office, and National Weather Service, local weather forecast offices, The Science Museum of Virginia, and U.S. Forest Service (USDA). 

Past support has come from Portland State University, the Climate Resilience Fund, and the National Science Foundation. CAPA Strategies is deeply grateful to these organizations for their continuing support. 

Results

Cities and more developed areas tend to be warmer than surrounding rural or less developed areas. These areas are referred to as urban heat islands. Buildings, roads, and other paved surfaces with a lack of shade hold on to more heat than natural landscapes or areas with more trees. 


  • In Clark County, areas with more buildings and development tend to be hotter during the afternoon. Industrial land use appears to create pockets of higher heat near residential areas.  
     
  • The hottest areas in the afternoon were most of the Vancouver area, including downtown, Orchards, Fourth Plain, and Fruit Valley. Washougal, downtown Camas, and downtown Battle Ground also had areas with higher temperatures.  
     
  • Cooler places during the afternoon included west and central Camas, and places with more green and natural spaces, like Burnt Bridge Creek Trail area in Vancouver. Areas with parks and street trees can provide relief from heat in denser urban areas.  
  • There is nearly a 10-degree difference in temperature during the evening, depending on location. In the evening, hotter areas included Washougal, central and east Vancouver (especially Ogden, Bennington, and Fisher’s Landing East neighborhoods). 
     
  • Ridgefield, La Center, northwestern Vancouver (Mount Vista, Felida, and Lake Shore neighborhoods), and northwest Battle Ground (Cherry Grove) appeared cooler in the evening. 
     
  • General limitations: Heat data was collected on one day in July 2024. We recommend data users focus more on the pattern of temperatures (hotter or cooler places) within each period, versus the actual temperatures measured at one point in time. 

How this data will be used

Clark County Public Health plans to compare Heat Watch data with other maps that include information about the built environment, social factors, and health inequities to further identify opportunities to support local communities with heat adaptation and resiliency efforts.

How communities, organizations, and decision-makers can use this data  

Heat maps can be used to inform the development and implementation of a range of cooling activities through land use, built environment, transportation, and community infrastructure policies and plans. The data can also be used to support grant applications, the development of extreme heat preparedness and response plans, and long-term climate action strategies. 

Use this data when:
  • Determining where to plant trees and increase vegetation/green spaces.  
  • Planning and designing infrastructure to include green roofs, green stormwater, and smart surface updates
  • Prioritizing where to add temporary or permanent shelters (e.g., cooling centers and covered bus stops). 
  • Advocating to preserve existing natural areas that provide respite from heat. 
  • Prioritizing equitable planning, collaboration and community engagement. 
  • Applying for energy-efficient upgrades and retrofits incentives (e.g., replacing oil and gas-based systems with heat pumps). 

Technical notes

tag

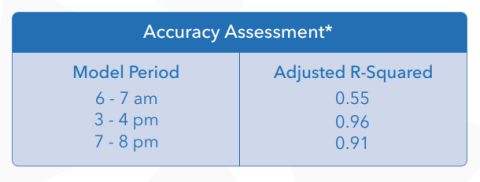
To assess the strength of our predictive temperature models, we employ a 70:30 “holdout cross-validation method,” which consists of predicting 30% of the data with the remaining 70%, selected randomly. An ‘Adjusted R-Squared’ value of 1.0 is perfect predictability, and 0 is total lack of prediction.  

Additional information on this technique can be found at the following reference: Voelkel, J., and V Shandas, 2017. Towards Systematic Prediction of Urban Heat Islands: Grounding measurements, assessing modeling techniques. Climate 5(2): 41. 

tag

The collection of temperature and humidity data requires adherence to a specific set of protocols and experimental controls. In the event unreported or undetected error is introduced during the data collection process, the accuracy of the resulting datasets and models may be compromised in quality. While CAPA Strategies has a developed a multi-stage process for quality assurance and quality control (outlier removal), some errors can go unidentified and undetected and thereby compromise the accuracy of the results.  

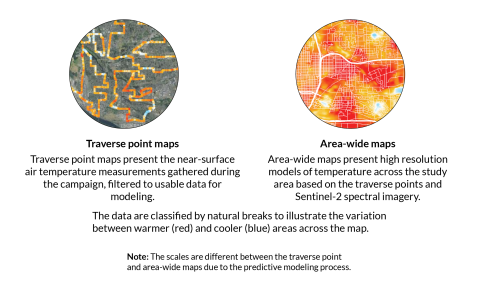
The traverse points used to generate the area-wide models do not cover every square mile of the studied area – CAPA strategies uses a sampling approach to gather representative measurements across the diversity of land-use, land-cover, and biophysical attributes of each study area.  

CAPA Strategies recommends keeping the nature of field data collection, sampling, and modeling in mind when reviewing the results.