Stream Health and Monitoring

Stream Health and Monitoring 

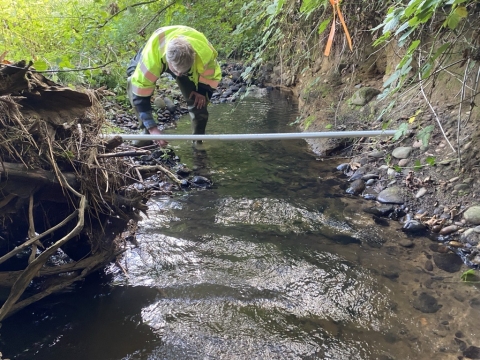
Water quality, hydrology and stream health monitoring provides data that inform and prioritize Clean Water’s efforts to protect county waterways. Monitoring allows the county to better understand the health of individual waterways or entire watersheds and follow over time if conditions are improving, deteriorating or not changing.  

Clean Water staff use monitoring information to design projects to improve stream health, coordinate watershed planning with other agencies and partners, and develop education, outreach and stewardship resources to support our community protecting water. Hydrology data is used to support development projects and measure changes in water quantity for regional planning. Monitoring is also required under the county’s NPDES Phase I Municipal Stormwater Permit. 

Body
Stream monitoring

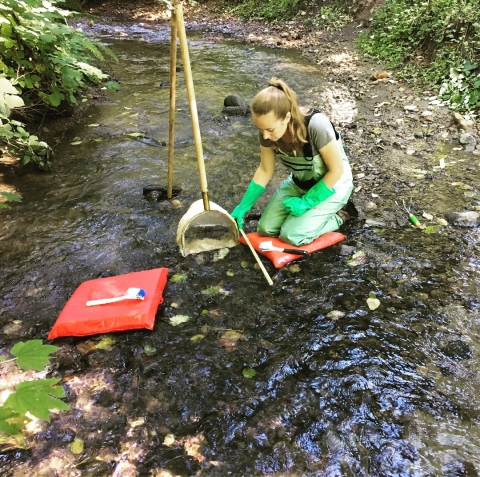
Clean Water staff collecting a benthic macroinvertebrate sample. 

Stream Health Report

The Clean Water Division maintains a Stream Health Report to share monitoring data with the community. The report includes interactive maps and data tables that display stream health trends, current and past statuses for various streams by water quality parameter, hydrology data and more. The Stream Health Report is part of the larger Explore Your Watershed StoryMap that covers Clark county’s watersheds, recreation opportunities and things people can do to protect water. View previous stream health reports below. 

Clark County monitors the current status of stream health at more than 40 sites and long-term trends at nine sites. The monitoring program assesses overall stream health based on water quality, biological health and stream flow conditions. View this data on the county’s Stream Health Report 

Lower Columbia Urban Streams Monitoring Section

This monitoring project is designed to assess the current stream conditions and eventually answer the question:  Are the quality and biota conditions of receiving waters in the region improving with broad implementation of required stormwater management practices? The Lower Columbia urban streams study collects water and sediment chemistry, in-stream and riparian habitat information, and benthic macroinvertebrate samples. Streamflow and temperature are continuously monitored at each site. Learn more about the project and see the data collected at Ecology’s Lower Columbia urban streams page. See full plan below.  

Stream Flow and Precipitation Monitoring Section  

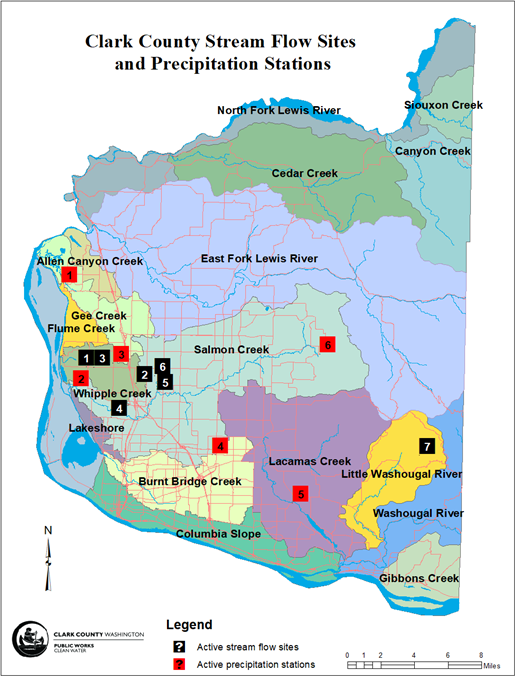
An important factor in stream health is the volume of water and how fast it moves through a stream, creek or river. Increased volumes and faster flows lead to erosion and loss of habitat within the stream channel and on the banks. The Clean Water Division monitors stream flow at seven locations and precipitation at six locations within the county. Hydrology data are used to support development projects, modeling efforts, and measuring changes in water quantity in support of regional water planning efforts. See hydrology data on the county’s Stream Health Report 

tag
Clark County Stream Flow Sites and Precipitation Stations

Active stream flow sites 

  1. Lower Whipple Creek (WPL048) 

  1. Upper Whipple Creek (WPL082) 

  1. Packard Creek (PCK012) 

  1. Cougar Creek (CGR018) 

  1. Mill Creek (MIL008) 

  1. Mill Creek Tributary (MIL2A) 

  1. Jones Creek (JNS058) 

Inactive stream flow sites (not shown) 

  1. Brezee Creek 

  1. Gee Creek at Abrams Park 

  1. Curtin Creek at NE 139th Street 

  1. Lacamas Creek at NE 217th Avenue 

  1. Lacamas Creek at Goodwin Road 

  1. Little Washougal River at Blair Road 

Active precipitation stations 

  1. Ridgefield (RDGFLD) 

  1. Salmon Creek Treatment Plant (SMCRTP) 

  1. Low-Density Residential (LDR010) 

  1. Whatley Pit (ORCHDS) 

  1. Lacamas Creek at Heritage Trail (LACHRT) 

  1. Venersborg (VNRSBG) 

Inactive precipitation stations (not shown) 

  1. Salmon Creek at NE 156th Street 

  1. Yacolt at Yacolt town hall 

  1. Cape Horn Elementary 

Stream Flow 

Clean Water division collects stream flow data at seven sites throughout the county. Data is available through water year (WY) 2024. Additionally, Clean Water has historical data at inactive sites listed above (please inquire about time periods available). Clark County stream flow data is available in the following formats: 

  • Hydrographs depict how average daily flow varies over time in cubic feet per second in .pdf format. 

  • Daily average stream flow provides the average daily flow values in cubic feet per second in .csv format. 

  • 15-minute stream flow time-series data provide instantaneous flow in cubic feet per second at 15-minute intervals in .csv format. 

Precipitation 

Clark County precipitation data is available in the following formats: 

  • Daily/monthly precipitation tables provide the daily and monthly total accumulated precipitation in hundredths of inches in .xlsx format. 

  • 15-minute time-series data provide accumulated precipitation in 15-minute intervals reported in hundredths of inches in .csv format. 

Water Year 

Stream flow and rainfall data is presented by water year. A water year begins October 1 and ends September 30 of the next year. The name of the water year is based on the January - September portion of that period. For example, WY 2024 is from October 1, 2023 through September 30, 2024. 

More information 

For more information about precipitation data and streamflow data, please contact us at 564.397.4018 or email cleanwater@clark.wa.gov. 

Need current precipitation data? 
 Visit the USGS web page for more information and data: 

Other regional sources can provide additional data: US Climate Data 

Microbial Source Tracking (MST) Section 

Elevated levels of bacteria can impair stream water quality. Microbial source tracking (MST), also referred to as bacterial or fecal source tracking, is a set of techniques used to determine the sources of fecal bacteria in the environment. MST techniques attempt to determine sources of fecal bacteria introduced into water bodies by humans, wildlife, or domestic animal sources. MST is used to support the county’s pollution identification and correction (PIC) efforts, where sources causing water quality issues can be pinpointed and corrected through outreach, technical assistance and other methods. PIC programs such as Poop Smart Clark have used MST in Whipple Creek and the East Fork Lewis River, see reports below.  

Illicit Discharge Detection and Elimination (IDDE) Section

Illicit discharges are broadly defined as polluted, non-stormwater discharges entering the storm sewer system.  Examples include improper cross-connections where sanitary sewer pipes are connected to storm sewer pipes, leaking sewer lines or septic systems, and illegal dumping of materials that reach storm drains such as wash water, waste oil or paint.  Illicit discharges contribute pollutants to stormwater and may cause exceedances of pollutant thresholds in receiving waters during baseflow conditions. The overall goal of the IDDE Screening project is to detect, isolate, and eliminate illicit discharges to Clark County’s storm sewer system. 

Heritage Farm Wetland Monitoring Section

As part of the larger Heritage Farm Wetland Restoration project, a 1500-foot channelized section of the Cougar Creek headwaters will be monitored before and after restoration to evaluate changes in wetland habitat, stream flows, and water quality. This restoration project provides an ideal opportunity to showcase the benefits of reversing historical ditching through the construction of a series of stepped wetland cells. The goals of the Heritage Farm Wetland Restoration project are to enhance and restore the Cougar Creek headwater wetland habitat, improve stream water quality and groundwater recharge, and reduce peak stormflows and downstream erosion from hard surface runoff. 

Other Types of Monitoring Efforts

Monitoring activities are conducted throughout Clark County’s watersheds, including in: 

tag

Lakes are unique resources that provide habitat for fish and wildlife, and recreation for county residents. While lakes provide enjoyment to thousands of people every year, they are also easily degraded by human activities. 

  • Clark County Public Health monitors local designated swim beaches at Vancouver Lake, Klineline Pond and Battle Ground Lake to determine if the water quality is safe for swimming and recreation. 

Clark County has provided lake monitoring in past years and various data and reports are available. To request reports, please call 564.397.4018. 

tag

There are hundreds of streams in Clark County. Clean Water Division scientists monitor many of these streams to assess water quality and biological health. The monitoring programs follow strict scientific protocols and standards to ensure high quality reporting. Monitoring requirements and timing vary per location and program needs and may include: 

  • Biological health - Number and diversity of aquatic insects to support fish, an overall indicator of stream health. 

  • Water chemistry - Different chemicals, compounds and substances, including metals, nutrients, bacteria and dissolved oxygen. 

  • Water temperatures - Cool water is critical for fish, especially salmon and steelhead. 

  • Turbidity - An indicator of how much dirt and other material is in the water. 

  • Stream habitat - Includes stream bank stability, erosion, erosion, substrate, stream bank and riparian vegetation and habitat. 

  • Stream flow – Measures the changing quantity of water in a stream over time. 

  • Pollution identification - Identifying illicit connections, sources of pollution, etc. 

tag

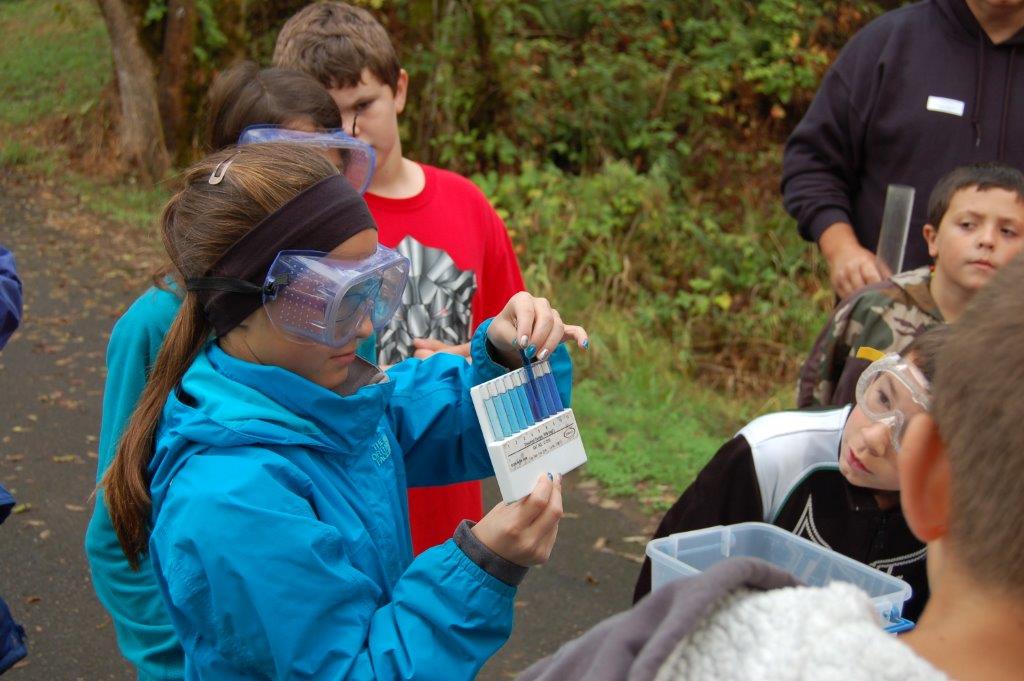
The Student Watershed Monitoring Network trains students, teachers and chaperones to monitor water quality and habitat in creeks, lakes, wetlands and stormwater facilities. The program serves approximately 3,000 K-12 students across Clark County each year and is a partnership between Clark County and the City of Vancouver’s Water Resources Education Center. 

Student Using Water Quality test kit

Publications and Reports  

The Clean Water Division’s Monitoring and Assessment reports follow standard operating procedures (SOPs) and quality assurance project plans (QAPP) and are available to the public with the goal of providing quality scientific information on our various projects. 
tag

Clark County’s Stream Health Reports compiles status and trends of water quality data, hydrological data and biological stream health data.  

tag

This technical study evaluated potential sources of fecal coliform in the most impaired tributaries to the East Fork Lewis River which include Jenny Creek, Brezee Creek, McCormick Creek, and Rock Creek North. Microbial Source Tracing in Tributaries to the East Fork Lewis River (PDF) 

tag

This quality assurance project plan details status and trends monitoring of urban streams in Clark and Cowlitz Counties in the Lower Columbia Region as part of Stormwater Action Monitoring program. It is designed to answer the question, “Are regional conditions in receiving water quality and biota improving in concert with broad implementation of required stormwater management practices?”. Quality Assurance Project Plan for Status and Trends Monitoring of Urban Streams in Clark and Cowlitz Counties in the Lower Columbia River Regions (PDF)   

tag

Clark County completed an effectiveness study from 2014-2017 at McCord’s Vancouver Toyota in Vancouver, Washington to evaluate infiltration performance of a maturing, large-scale interlocking concrete paver block (ICPB) parking lot installation in a region with extended wet seasons and ubiquitous moss growth. Modular Pavement Effectiveness Study – Low Impact Development LID (PDF)